
Greener Eynsford Blog
Green news and views relevant to our community
Success for Chalk themed Great Big Green Week!
25th June 2026
Eynsford's Green Team put on a very sucessful series of event for the Great Big Green Week this year and used the theme of 'Our Chalk Landscape' as a focus.
Events and activities took place between 6th and 13th June 2026 in Eynsford.
These were:
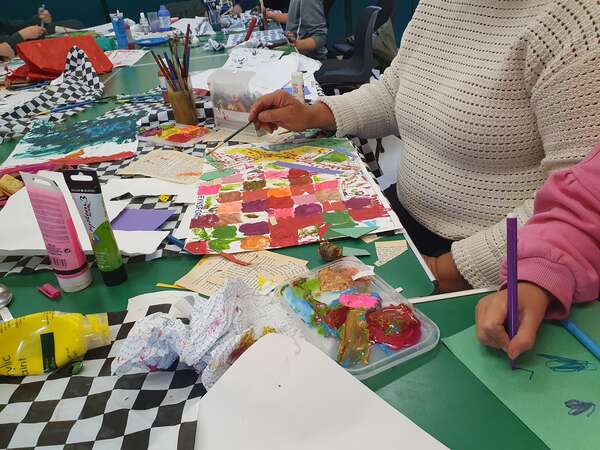
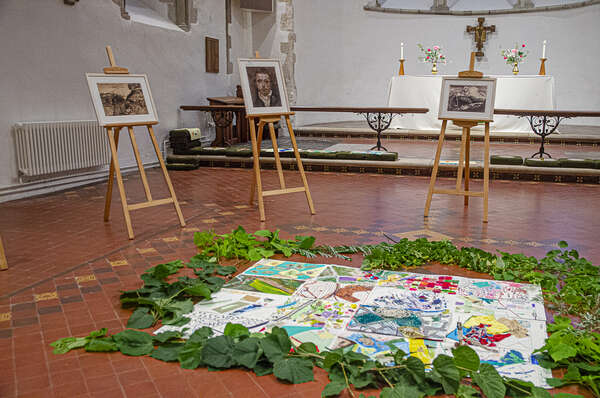
A community art workshop attracting both adults and families with children. Participants were encourage to gather natural resources from the nearby chalk grassland and use them for mark making, as tools and to create different textures. The workshop focused on recreating a map of Eynsford. Paricipants were each given an englarged section of a map and were invited to fill it as they wished, responding to the landscape and using a variety of media including paint, pens, collage, printing, chalk and much more.
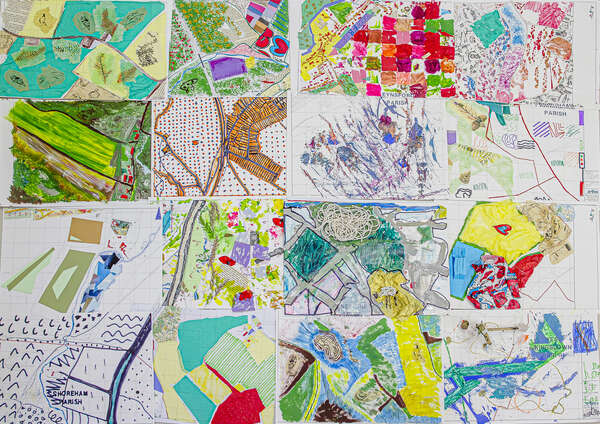
The final pieces were put together to show the whole of the village and were showcased at the evening event at St Martin's Church.
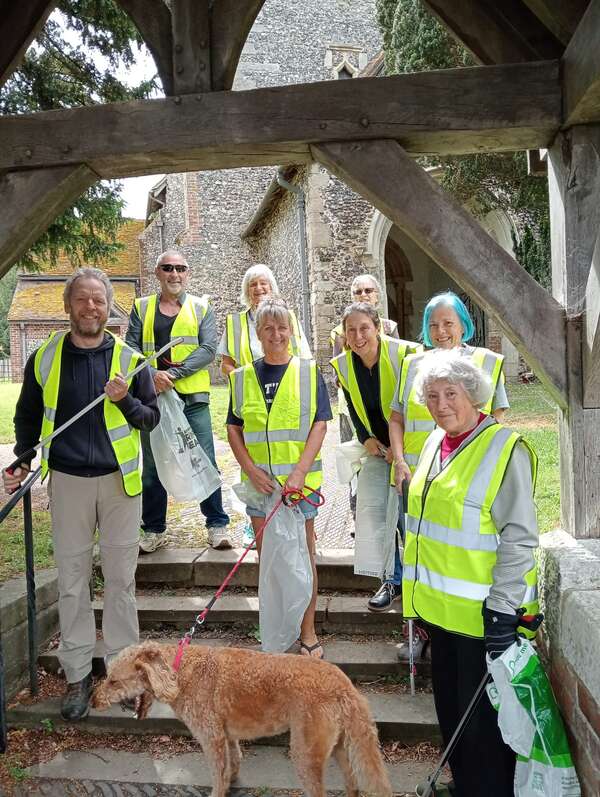
A litter pick took place around the village attracting around a dozen volunteers who worked hard to clear rubbish from our streets and green spaces.
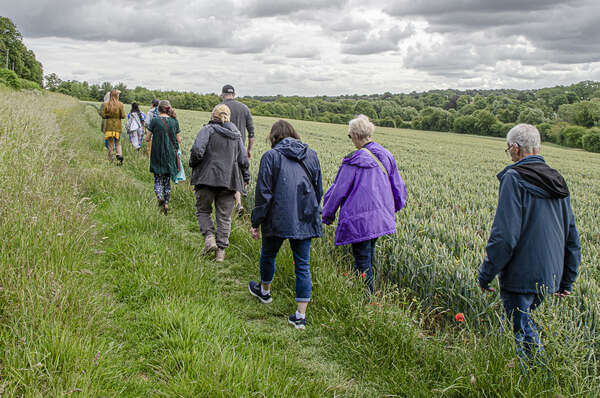
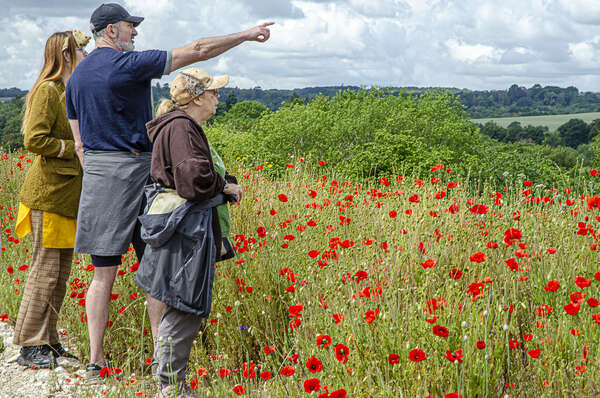
A walk was led by an environmentalist through parts of our local chalk landscape. This focused on the flora and fauna that could be found there as well as the history of our landscape.
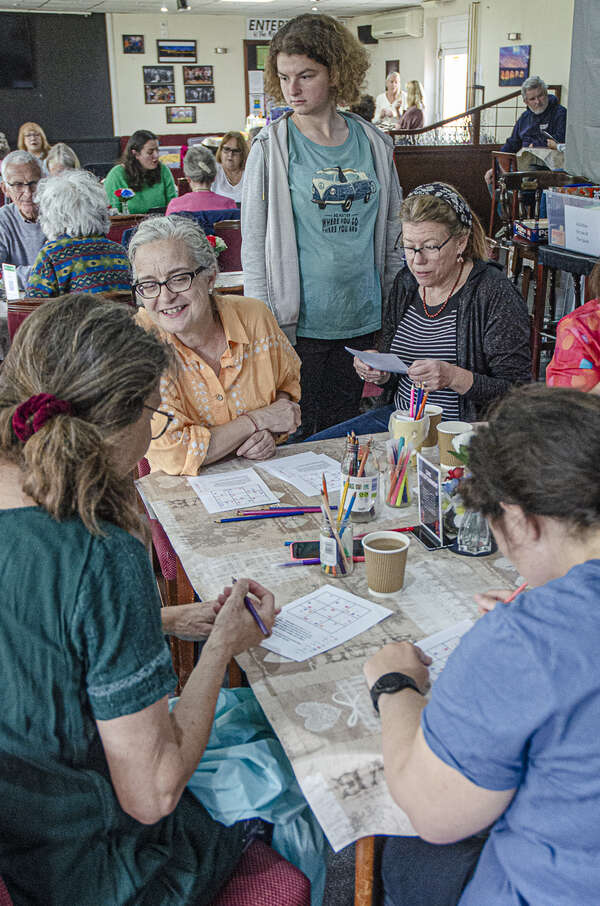
An activity was arranged for attendees of The Space (a wam space in Eynsford for members of our community). This was a plant based soduku!!
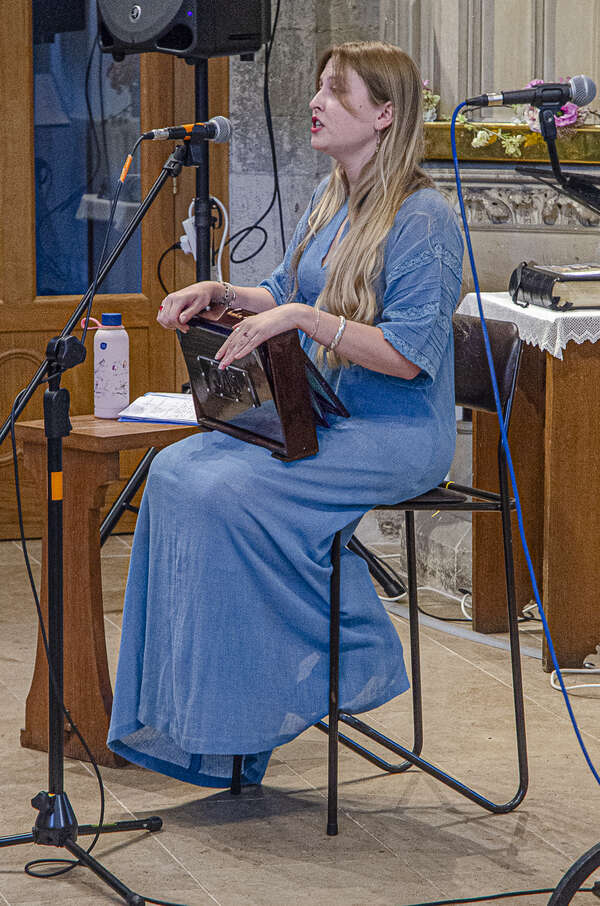
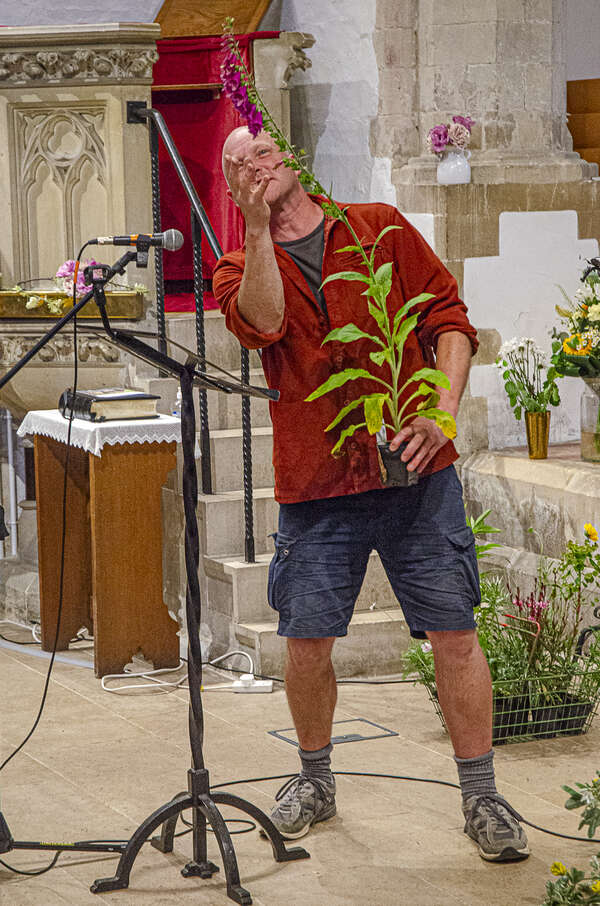
A fantastic evening was arranged for the Friday night at St Martin's Church. A Kent Downs Geoambassador gave an introduction to 'chalk', what it is and where it comes from. A writer and musician from Kent Downs performed a piece exploring the Kent landscape through words and music. A local singer/songwriter performed songs taking inspiration from our landscape and the river Darent (a chalk stream). Local horticulturalist Tom Hart Dyke spoke passionately about plants that thrive on chalk both in the wild and in our gardens. Those who attended enjoyed a glass of wine, were able to look at the 'map' from the community art workshop, to see prints of works by Samuel Palmer, and to speak to a representative from DRiPS about the work they are undertaking on the river Darent.
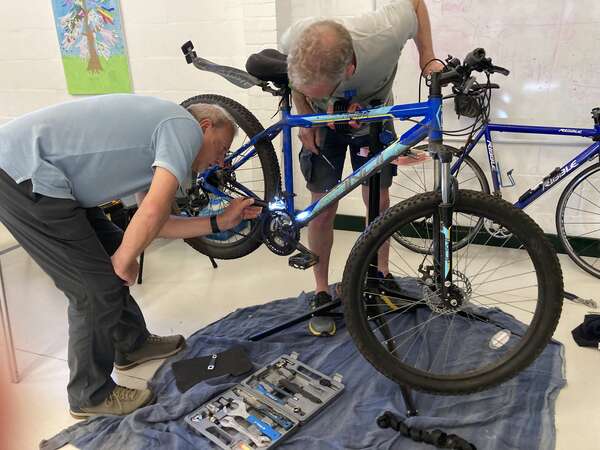
The final day of activities was a Repair Cafe were a number of items were repaired, lots of cake eaten, and plenty of tea drunk!
Thank you to everyone who took part.
Thank you to Eynsford Parish Council and to South East Rivers Trust for funding the week with a Heritage Lottery Fund grant.
Eynsford's Big Green Week June 2026
14th May 2026
Eynsford’s Big Green Week, 4 - 20th June 2026
Once again the Parish Green Team are taking up the challenge of the national Big Green Week, this time with more activities and events than ever before. Our theme this year is ‘Chalk’! We celebrate and explore our chalk landscape; the river that runs through it and the biodiversity it supports.
The keen eyed amongst you will have spotted that our ‘week’ is rather longer than normal – we just couldn’t fit everything in seven days, so cheekily we are stretching time!
The programme:
3-4 June
School Workshop
Specially for years 5 and 6, an in-school workshop by the Kent Downs National Landscape ‘geoanimator’ on Chalk, fossils and the megaflood. (Anthony Roper School)
2-4pm, Saturday, 6th June: Scout Hall
Creating our Village
Art Workshop for families/all ages. – Booking required £ £5 each(under 5s free) Meet at Harrow Meadow/Chalk Hill, main workshop in the scout hall. Teas, coffee and biscuits available.
Working together we will create an exciting new map of our village. With our artist guide we will start with a walk along chalk hill with everyone encouraged to take photographs and collect small items (chalk, stones, leaves etc) to use as inspiration for collaborative artwork.
Once at the scout hut each person will be given an enlarged piece from a map of Eynsford. Using collage, other simple materials and even the chalk you have found, you will use this inspiration to bring to life the roads, houses and fields shown on the map. At the end of the session the local artist will bring all the sections of the map together to create a vision of our village created through nature.
We will be showing the final work in St Martin's Church on Friday 12th June 6.30-8.30pm. A photographer will take a high-quality image of the map and all participants will be sent a copy.
To Book: https://www.eventbrite.co.uk/e...
10.30am Sunday 7th June: Meet outside St Martin's Church, High Street
Village Litter Pick
Please come along and make our village cleaner and safer for local wildlife. You will be provided with a litter picking stick, plastic bags and safety tabards. Meet outside St Martin's Church.
9.30 am Wednesday 10th June: Meet at the Space, Riverside Club, Riverside
Chalk WalkChalk landscape expert Guillaume will lead a short walk along the Darent valley from Eynsford to Farningham.
Chalk valleys and their associated down lands in southern England are exceptionally rich ecosystems, supporting up to 40 plant species in a single square metre. These areas are characterised by thin, nutrient-poor alkaline soils, specialised, colourful flora, and a variety of unique, often rare, butterflies.
Starting from The Space at The Riverside club, Riverside , Eynsford, Guillaume will lead a fact finding and educational walk discussing the typical look of a chalk Grassland area and hopefully encountering some rare chalk plants on the way like pyramidal, bee, man and rare early spider orchid, Kidney vetch, wild thyme, salad burnet, squinancy wort, fairy flax, carline thistle, field scabious, and viper’s bugloss.
Eynsford in Bloom will also have a table at The Space to introduce people to the chalk landscape’s flora and fauna with a game of plant sudoku.
2-4pm, Friday 12th June: Olive Seal Hall, Pollyhaugh
GeoPoetry Workshop – Wise Words for the Earth
Workshop for adults interested in exploring ideas and writing – Booking required: £5.00. Maximum 14 places. Teas, coffee and cake/biscuits available.
The session is run by Helen Nattrass and Victoria Field
Over a two-hour session we will write to prompts inspired by chalk, flint and earth processes to create individual reflections on our beautiful Kent landscape. We will read and respond to poems and prose on geological themes. The event is open to all, and no previous writing experience is necessary, just a willingness to participate. Bring paper and something to write with.
Helen is a Library Volunteer, coordinating Wise Words for Wellbeing, and a Geologist (see was at the Channel tunnel breakthrough!). She was a participant in Earth Lines. Victoria is a Writer, Researcher and Poetry Therapist and an Associate in the Academy for Sustainable Futures at Canterbury Christ Church University.Both Helen and Victoria are Geoambassadors for the UNESCO Cross-Channel Geopark https://geoparktransmanche.org/en/
To Book: https://www.eventbrite.co.uk/e...
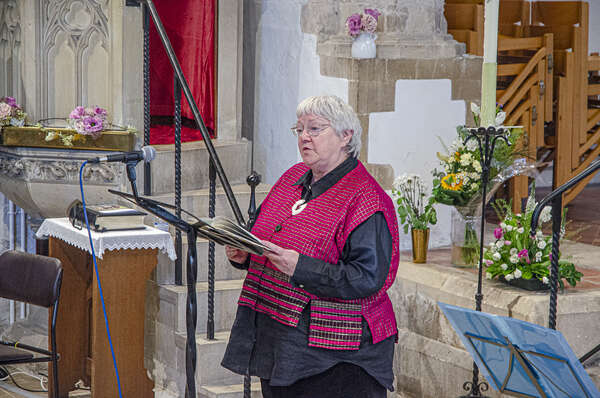
6.30 -8.30pm Friday 12th June: St Martin’s Church
‘Our Landscape’: Chalk under, river through, growing in the soil above
Join us for another thought provoking evening. This year we offer three different views of the valley. An evening of 3 parts: music and poetry inspired by the chalk beneath our feet, our own special river, the Darent and Tom Hart-Dykes irrepressible enthusiasm for plants. FREE, a glass of wine/soft drink provided. Donations welcome.
An introduction to our Chalk Landscape - Helen Nattress
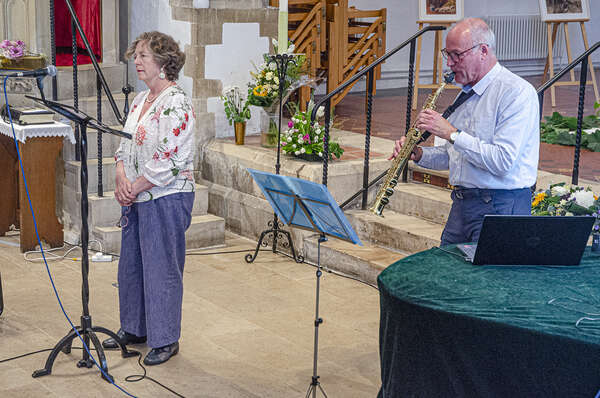
ACT 1: Step by Step, Grain by Grain - A Walk Across Chalk and Flint
Through poetry, music and ambient sound, Victoria Field and Eduard Heyning celebrate the pilgrim paths of Kent and the iconic geology, flora and fauna that link the North Downs, the Weald and the coast. Soft chalk and hard flint come from the same deposits, and yet look and feel utterly different, one changing into the other grain by grain. As we walk a path through the landscape, we are shaped by the earth under our feet, breath by breath, step by step, and in turn, humans have shaped the Kentish landscape both quickly and slowly over the centuries. Our original poetry and musical compositions inspired by chalk and flint offer a reflective response to the deep time of geology and our precious contemporary landscape.
Dr Victoria Field is a writer and poetry therapist who has been widely published. Her latest books include a poetry collection, A Speech of Birds and a memoir of pilgrimage and marriage, Baggage: A Book of Leavings. Eduard Heyning has degrees in music and philosophy. He composes and plays clarinets and saxophones. Recent performances included the Geological Society in London, Samphire Hoe near Folkestone, and the Lilford Gallery in Canterbury.
Interval
ACT 2 – The River
Helena has begun drawing her attention to the plight of Britain's chalk streams and is working on an upcoming project created in collaboration with the river Darent itself. For her performance she will sing a mix of original songs written in response to the river as well as traditional songs that explore our human connection to rivers in a broader sense. This will be accompanied by personal reflections of her childhood growing up near the river and her experience now as a wildlife volunteer and environmentalist. .
Helena Day is a singer and songwriter living near the Darent Valley. Her soulful sound pulls influence from traditional folk as well as vocal jazz, and is deeply rooted in her natural surroundings. Her debut album 'When all the Birds Have Flown Away' centres on Britain's declining bird populations and is due for release this year. Her music has been described by BBC Radio Kent as sounding "like a fairy tale".
ACT 3 – Gardening in a chalk landscape: Tom Hart-Dyke – Tom will talk about the plants that thrive in the chalk soils of the Darenth Valley and how the changing climate will affect the species that will do will. He will be bringing samples and his usual immense enthusiasm!
Tom was born in Kent in 1976 and his horticultural passion, nurtured by his late grandmother Mary Hart Dyke. He spent his early twenties travelling the world in search of rare orchids and plants. In 2000 he was kidnapped in the Panamanian jungle on a plant hunting expedition that went dangerously wrong. The idea for the World Garden was born in the depths of despair in the Colombian jungle. After Tom’s return home to his ancestral home of has been busy building the 'World' in his back garden at Lullingstone Castle.
Tom continues to plant hunt around the world, gathering new plants for the World Garden. He was awarded an Honorary Doctorate from Canterbury Christ Church University on 27th January 2017. Tom has authored two books - 'The Cloud Garden’ (2003) and the story behind BBC2’s popular series 'Save Lullingstone Castle', and 'Return to Lullingstone Castle', produced by Keo Films entitled 'An Englishman's Home' (2011). Both are on sale at Lullingstone.
The World Garden — Lullingstone Castle & The World Garden
Helen and Victoria are Geopark Ambassadors
1pm-4pm Saturday 13th June: Scout Hall, Priory Lane, Eynsford
Repair Café
Bring along those much loved but no longer perfectly working items. Sit and have a chat and a cup of tea whilst our menders do their best to bring your items back to life.
We have a team that sew and darn, mechanical and electrical wizzes and bike repair.
And everything we can give longer life to cuts the waste we create and emissions we produce. We’ve already saved more than a ton of carbon …….and created quite a few smiles!
2-4pm Saturday 20th June: St Martin’s Church, High Street, Eynsford
Gardeners Club Show
This will include exhibits relating to chalk.
We are grateful to the National Lottery Heritage Fund (thanks to National Lottery Players) and South East Rivers Trust for funding towards these events.


Gold for Environmental Work!
4th November 2025
In 2025 the Green Team worked with Eynsford in Bloom to produce a submission for the South and South East in Bloom Environmental Challenge. This year we were awarded a GOLD award!
The report describes the wide number of environmental projects and initiatives taking place in Eynsford including: wild areas in private gardens, creation of habitats for wildlife, planting and cultivating of native plants, developing new biodiverse areas such as Chalk Hill, litter picks and green energy usage.
You can read the full report here Eynsford Environmental Challenge 2025
Eynsford Wins Environmental Challenge!
15th October 2024
Eynsford's Green Team entered the Environmental Challenge with Eynsford in Bloom as part of thier South and South East in Bloom entry for 2024. It detailed lots of the projects that both groups have undertook in the past year, some of them jointly. Eynsford received a GOLD award and was the category winner for the region! You can read the submission here.
Individual Carbon Footprint - May 2023
6th July 2023
Eynsford Green Team: Personal Carbon Footprint Monthly 2022 and 2023

My carbon footprint in May (0.39 T/CO2e) was lower than April (0.55 T/CO2e) because April included a flight to Ireland (0.2T/co2e). It is similar to May 2022 though the mix is different. I now have an electric car so electricity is larger this year but petrol should be lower. In practice in May I had a holiday in NW Scotland and this increased the car mileage so the footprint ended up similar to 2022. The impact from alternative travel options to Scotland (1300 miles return) I compare below.

The main alternatives to get to NW Scotland were take the electric car, take a small petrol car (99g/km), take train to Inverness and hire a car, fly to Inverness and hire a car. The carbon impact of the four options is above, with flying being the greatest impact at 0.35 T/CO2e, the electric car lowest at 0.04 T/CO2e, a tenth of the impact of flying. A small petrol car with 2 people is 0.12 T and train 0.08 T. Interesting that sharing a small petrol car brings it close to the train.
We chose to take the small petrol car, given concerns about finding charging points in NW Scotland. In practice, rather ironically, the nearest charging point to the place in Torridon was only 3 miles away and the nearest garage for fuel was 20 miles away. The Scottish government have been developing charging points very strongly.
Questions : We would love to receive and discuss any questions info@eynsfordparishcouncil.org.uk
Individual Carbon Footprint - March 2023
6th July 2023
Eynsford Green Team: Personal Carbon Footprint March 2023
Annual overview: Personal Carbon Footprint by month 2022 and 2023

My carbon footprint in March 2023 was actually slightly higher than the previous month although lower than in 2022. The change from 2022 comes firstly from having more people in the house (we are hosting a Ukrainian family) so the energy use per person has become less – this is a personal (1 person) carbon footprint. Secondly from switching from a diesel to an electric car, so car footprint comes down but electricity has gone up.
March Month: Personal Carbon Footprint 2022 and 2023

My March footprint (0.42 T/CO2e) was slightly higher than February (0.39 T/CO2e). Two main factors – house gas use went up 10% (3451 kwh Mar vs 3079 kwh in Feb). In my mind I think March was a bit grey and damp so that may be the explanation. The official statistics come out a month in arrears so I only have Feb to go on, we’ll have to wait next month to see if that’s correct. House electricity use mainly from charging the car went up to 519 kwh March vs 380 kwh Feb given higher mileage in the car.
In the month 161 kwh were produced by the PV panels on my roof, around half of which was utilized in the house and half exported to the grid. 519kwh were taken from the grid. 315kwh were used to charge the car and 284 kwh to light and power the house.
Questions
We would love to receive any questions and could use this forum to discuss the most common ones. info@eynsfordparishcouncil.org.uk